To diagnose PL/SQL performance problems, Oracle provides the Hierarchical profiler. The profiler produces a stack trace with timings. After feeding this trace into the Oracle provided tools a bunch of html files are created that provide you with all sorts of aggregates to find the performance bottleneck in your PL/SQL code.
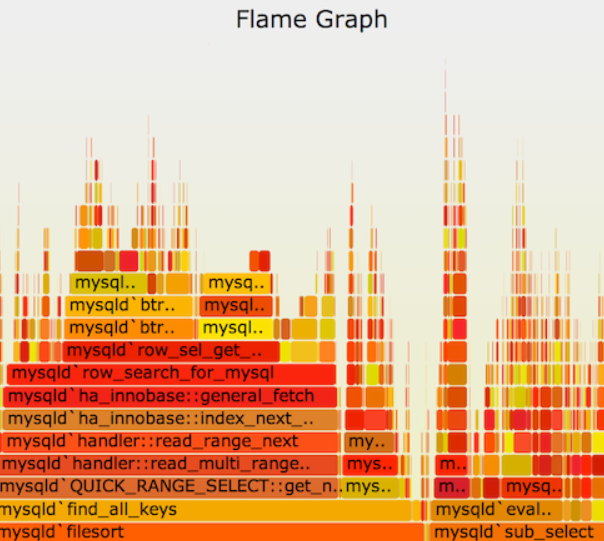
Imagine all those numbers visualised in a graph, that would provide an insight in your code in the blink of an eye. Well, such a tool exists. Brendan Gregg created Flame Graph.
Brendan’s site lists all sorts of scripts for a whole plethora of programming languages. But, PL/SQL is missing.
Get the stack collapse perl script below and Follow the steps outlined to create a PL/SQL flame graph.
Step 1. Profile your code
SQL> exec dbms_hprof.start_profiling('PROFILER', 'flame_trace.trc');
 PL/SQL procedure successfully completed (0 ms)
SQL> <Execute your code here>
SQL> exec dbms_hprof.stop_profiling;
 PL/SQL procedure successfully completed (16 ms)
SQL>
Step 2. Stack collapse your trace file
Next, grab the trace file (flame_trace.trc in this case) from the ‘PROFILER’ directory and run it through the stackcollapse-hprof.pl script (get it here )
js@hercules# ./stackcollapse-hprof.pl flame_trace.trc > flame_trace_collapse.trc
Stop 3. Create the flame graph
js@hercules# ./flamegraph.pl --minwidth 0.001 --title "Stack collapsed" flame_trace_collapse.trc > flame.svg
Et voilà, an interactive Flame Graph SVG is created.
